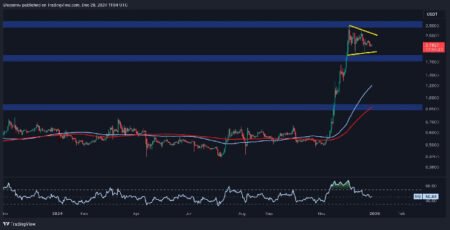
The cryptocurrency XRP has recently been making headlines as its price has seen an upward trajectory, with it currently trading at $2.60 after a 7.3% gain in the past 24 hours. On the 1-hour chart, XRP has been consolidating tightly between $2.55 and $2.65, indicating reduced volatility. However, the relative strength index (RSI) is at 75.74, signaling overbought conditions. The moving average convergence divergence (MACD) is at 0.43886, showing positive signals, but low volume during this consolidation reflects cautious market sentiment. A breakout above $2.65 could lead XRP to bullish momentum towards $2.75 and higher, while a breakdown may test support at $2.45.
Looking at the 4-hour chart, XRP shows a retracement from a recent peak of $2.91 to $2.10, followed by a gradual recovery with higher lows. Key oscillators like the awesome oscillator (AO) and Stochastic indicate neutral signals, suggesting a balanced market. XRP buyers are accumulating around the $2.30 to $2.50 range. A sustained move above $2.75 could confirm more optimistic momentum, while failing to hold $2.30 may result in further drawdowns.
On the daily XRP chart, a robust uptrend is observed as the digital asset surged from $0.50 to a recent high of $2.91. However, declining volume hints at weakening momentum, with resistance near $2.90 being a key level. Long-term moving averages like the exponential moving average (EMA) and simple moving average (SMA) for 200 periods show strong buy signals, with current support in the $2.20-$2.40 range being crucial for bullish continuation.
Oscillators present a mixed sentiment, with the RSI indicating overbought conditions while the MACD reflects bullish potential. The commodity channel index (CCI) and momentum oscillator suggest selling pressure may persist. However, all moving averages, from short-term EMA (10) to long-term EMA (200), signal a strong market, supporting a positive bias over the medium to long-term.
In terms of a bullish verdict, if XRP breaks above $2.65 and sustains momentum through $2.75 on the 4-hour chart, it could potentially retest the $2.90 resistance or exceed $3.00. The buy signals from moving averages and steady higher lows on various timeframes point towards strong bullish potential in the medium to long term. Conversely, a failure to hold critical support at $2.30 or a breakdown from the consolidation range could increase bearish pressure. Signals like the overbought RSI and selling pressure from momentum indicators may lead to a retracement towards $2.10 or even $1.90 if broader sentiment weakens.


