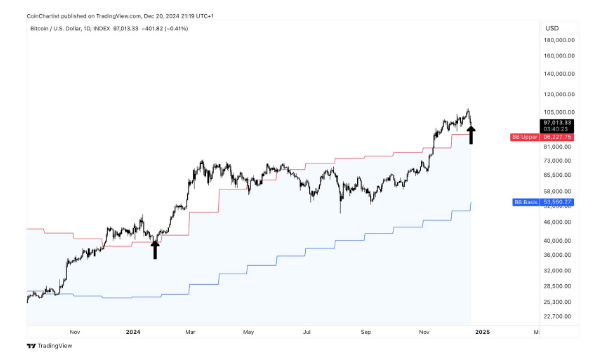
Bitcoin has been experiencing a correction since it hit a new all-time high of $108,135 on December 17th. This correction has led to the cryptocurrency dropping by about 10% and even falling below $93,000. The decline in Bitcoin’s price has caused it to retest the Bollinger Bands, with technical analysis indicating a potential bounce back up to $178,000.
Crypto analyst Tony Severino has pointed out the importance of Bitcoin retesting the monthly upper Bollinger Ban, a critical technical indicator that measures market volatility and potential reversal points. Severino’s analysis suggests that Bitcoin may be on the verge of entering a new phase of upward momentum after the recent corrections. The upper Bollinger Band is currently around $96,000, aligning with Bitcoin’s current price.
Severino has drawn parallels between Bitcoin’s current price movement and its behavior in January 2024 when a similar retest of the monthly upper Bollinger Band preceded an 86% rally in Bitcoin’s price. This rally pushed Bitcoin to break its all-time high and surpass $70,000 for the first time in March. If Bitcoin were to replicate this 86% rally now, it could potentially reach $178,000, which coincides with the upper range of Severino’s target zone.
Despite Bitcoin trading at $96,402 at the time of writing, down by 2.11% in the past 24 hours, there are signs that the selling pressure may be easing. The Relative Strength Index (RSI) has fallen from 69 on December 17 to 45, indicating the impact of the correction. However, the RSI level of 43 has historically acted as a significant support zone for Bitcoin since September, suggesting that Bitcoin may have a strong foundation for a move towards $178,000.
The recent pullback in Bitcoin’s price has led to over $5.72 billion in profits being realized, adding to the short-term selling pressure. Despite this, there is optimism that Bitcoin’s price may soon recover and continue its upward trend. Severino predicts that Bitcoin could reach its market top as early as January 20, 2025, based on his analysis of the current price movement and historical patterns observed in Bitcoin’s behavior.
In conclusion, Bitcoin’s recent correction and retesting of the Bollinger Bands have sparked a debate among analysts about its next potential price movement. While the short-term market volatility may have caused a temporary decline in Bitcoin’s price, there are indications that the selling pressure may be easing, paving the way for a potential rally back up to $178,000. Investors are advised to closely monitor Bitcoin’s price levels and technical indicators to make informed decisions in the volatile cryptocurrency market.

