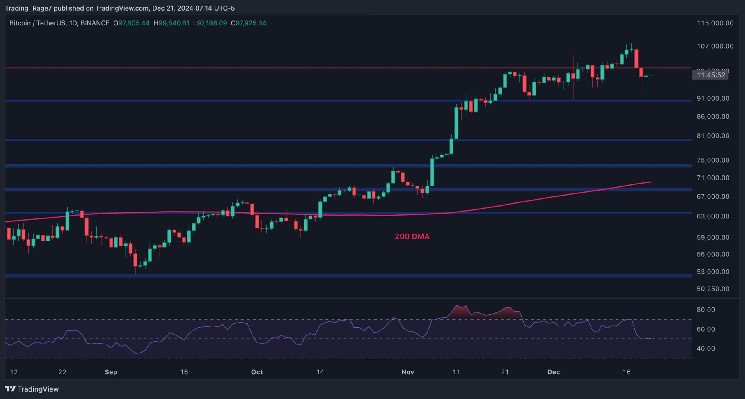
Bitcoin’s price has shown signs of potential for a deeper correction as it has failed to maintain the $100K level. According to technical analysis by Edris Derakhshi (TradingRage), on the daily chart, the price has been steadily rising but recently fell below $100K to as low as $92,000. If the market does not reclaim this area soon, a further correction towards $90K and even the $80K support zone could be seen in the short term.
Looking at the 4-hour chart, the price action appears more uncertain. The market has been creating higher highs and lows inside an ascending channel, but has been rejected from the upper boundary around $108K. With the $100K level broken to the downside and the RSI indicating bearish momentum, a drop below $90K could be on the horizon if the lower trendline is breached. However, a recovery above $100K and a bullish continuation could occur if the pattern holds.
On-chain analysis also provides valuable insights into Bitcoin’s market dynamics. Active addresses, a key metric for network activity, have been recovering rapidly during the recent uptrend but have not yet reached their all-time high. The divergence between price action and network activity suggests that if active addresses do not make a new record high and start to decline, a significant correction for Bitcoin could take place.
In conclusion, Bitcoin’s price is showing signs of a potential deeper correction as it struggles to hold the $100K level. Technical analysis indicates the possibility of a drop towards $90K and $80K if the market fails to reclaim the area soon. Additionally, on-chain metrics such as active addresses suggest that a divergence between price action and network activity could lead to a lengthy correction for Bitcoin if not addressed. Investors and traders should monitor these indicators closely to make informed decisions in the volatile cryptocurrency market.


