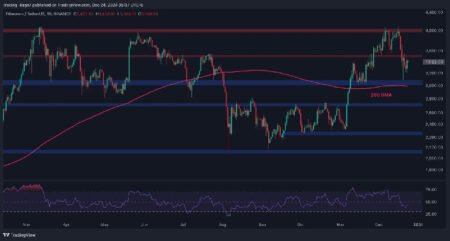
Ethereum price has been on a roller coaster ride, dropping below the $3,450 zone before starting to recover losses. The price struggled to gain momentum above $3,500 and extended losses, trading below $3,450 and the 100-hourly Simple Moving Average. However, there was a break above a connecting bearish trend line with resistance at $3,300 on the hourly chart of ETH/USD, indicating a potential increase if it clears the $3,450 and $3,500 resistance levels.
Currently, Ethereum price is consolidating above the $3,220 and $3,200 support levels after forming a low at $3,220. The price managed to break above the $3,250 level and the 50% Fib retracement level, showing signs of a possible upward movement. However, it still faces resistance near the $3,445 level and the 61.8% Fib retracement level. The main hurdle lies at $3,550, with a potential move towards $3,650 resistance and beyond. A break above $3,650 could lead to further gains towards the $3,720 and $3,800 levels.
On the flip side, if Ethereum fails to clear the $3,445 resistance, it could continue to decline. Initial support is at $3,300, followed by major support at $3,220. A break below $3,200 support could push the price towards $3,120 and potentially down to $3,050 support level. Technical indicators show that the MACD for ETH/USD is losing momentum in the bearish zone, while the RSI is currently above the 50 zone.
In conclusion, Ethereum price is currently facing resistance levels at $3,445 and $3,550, with potential for a bullish breakout towards $3,650 and above. On the other hand, failure to clear the resistance levels could lead to further downside towards $3,220 and $3,200 support levels. Traders and investors should closely monitor the price action and key support and resistance levels for potential trading opportunities in the near term.


